Representation Matters: Women in Power
Data Visualization | Craft
The Concept
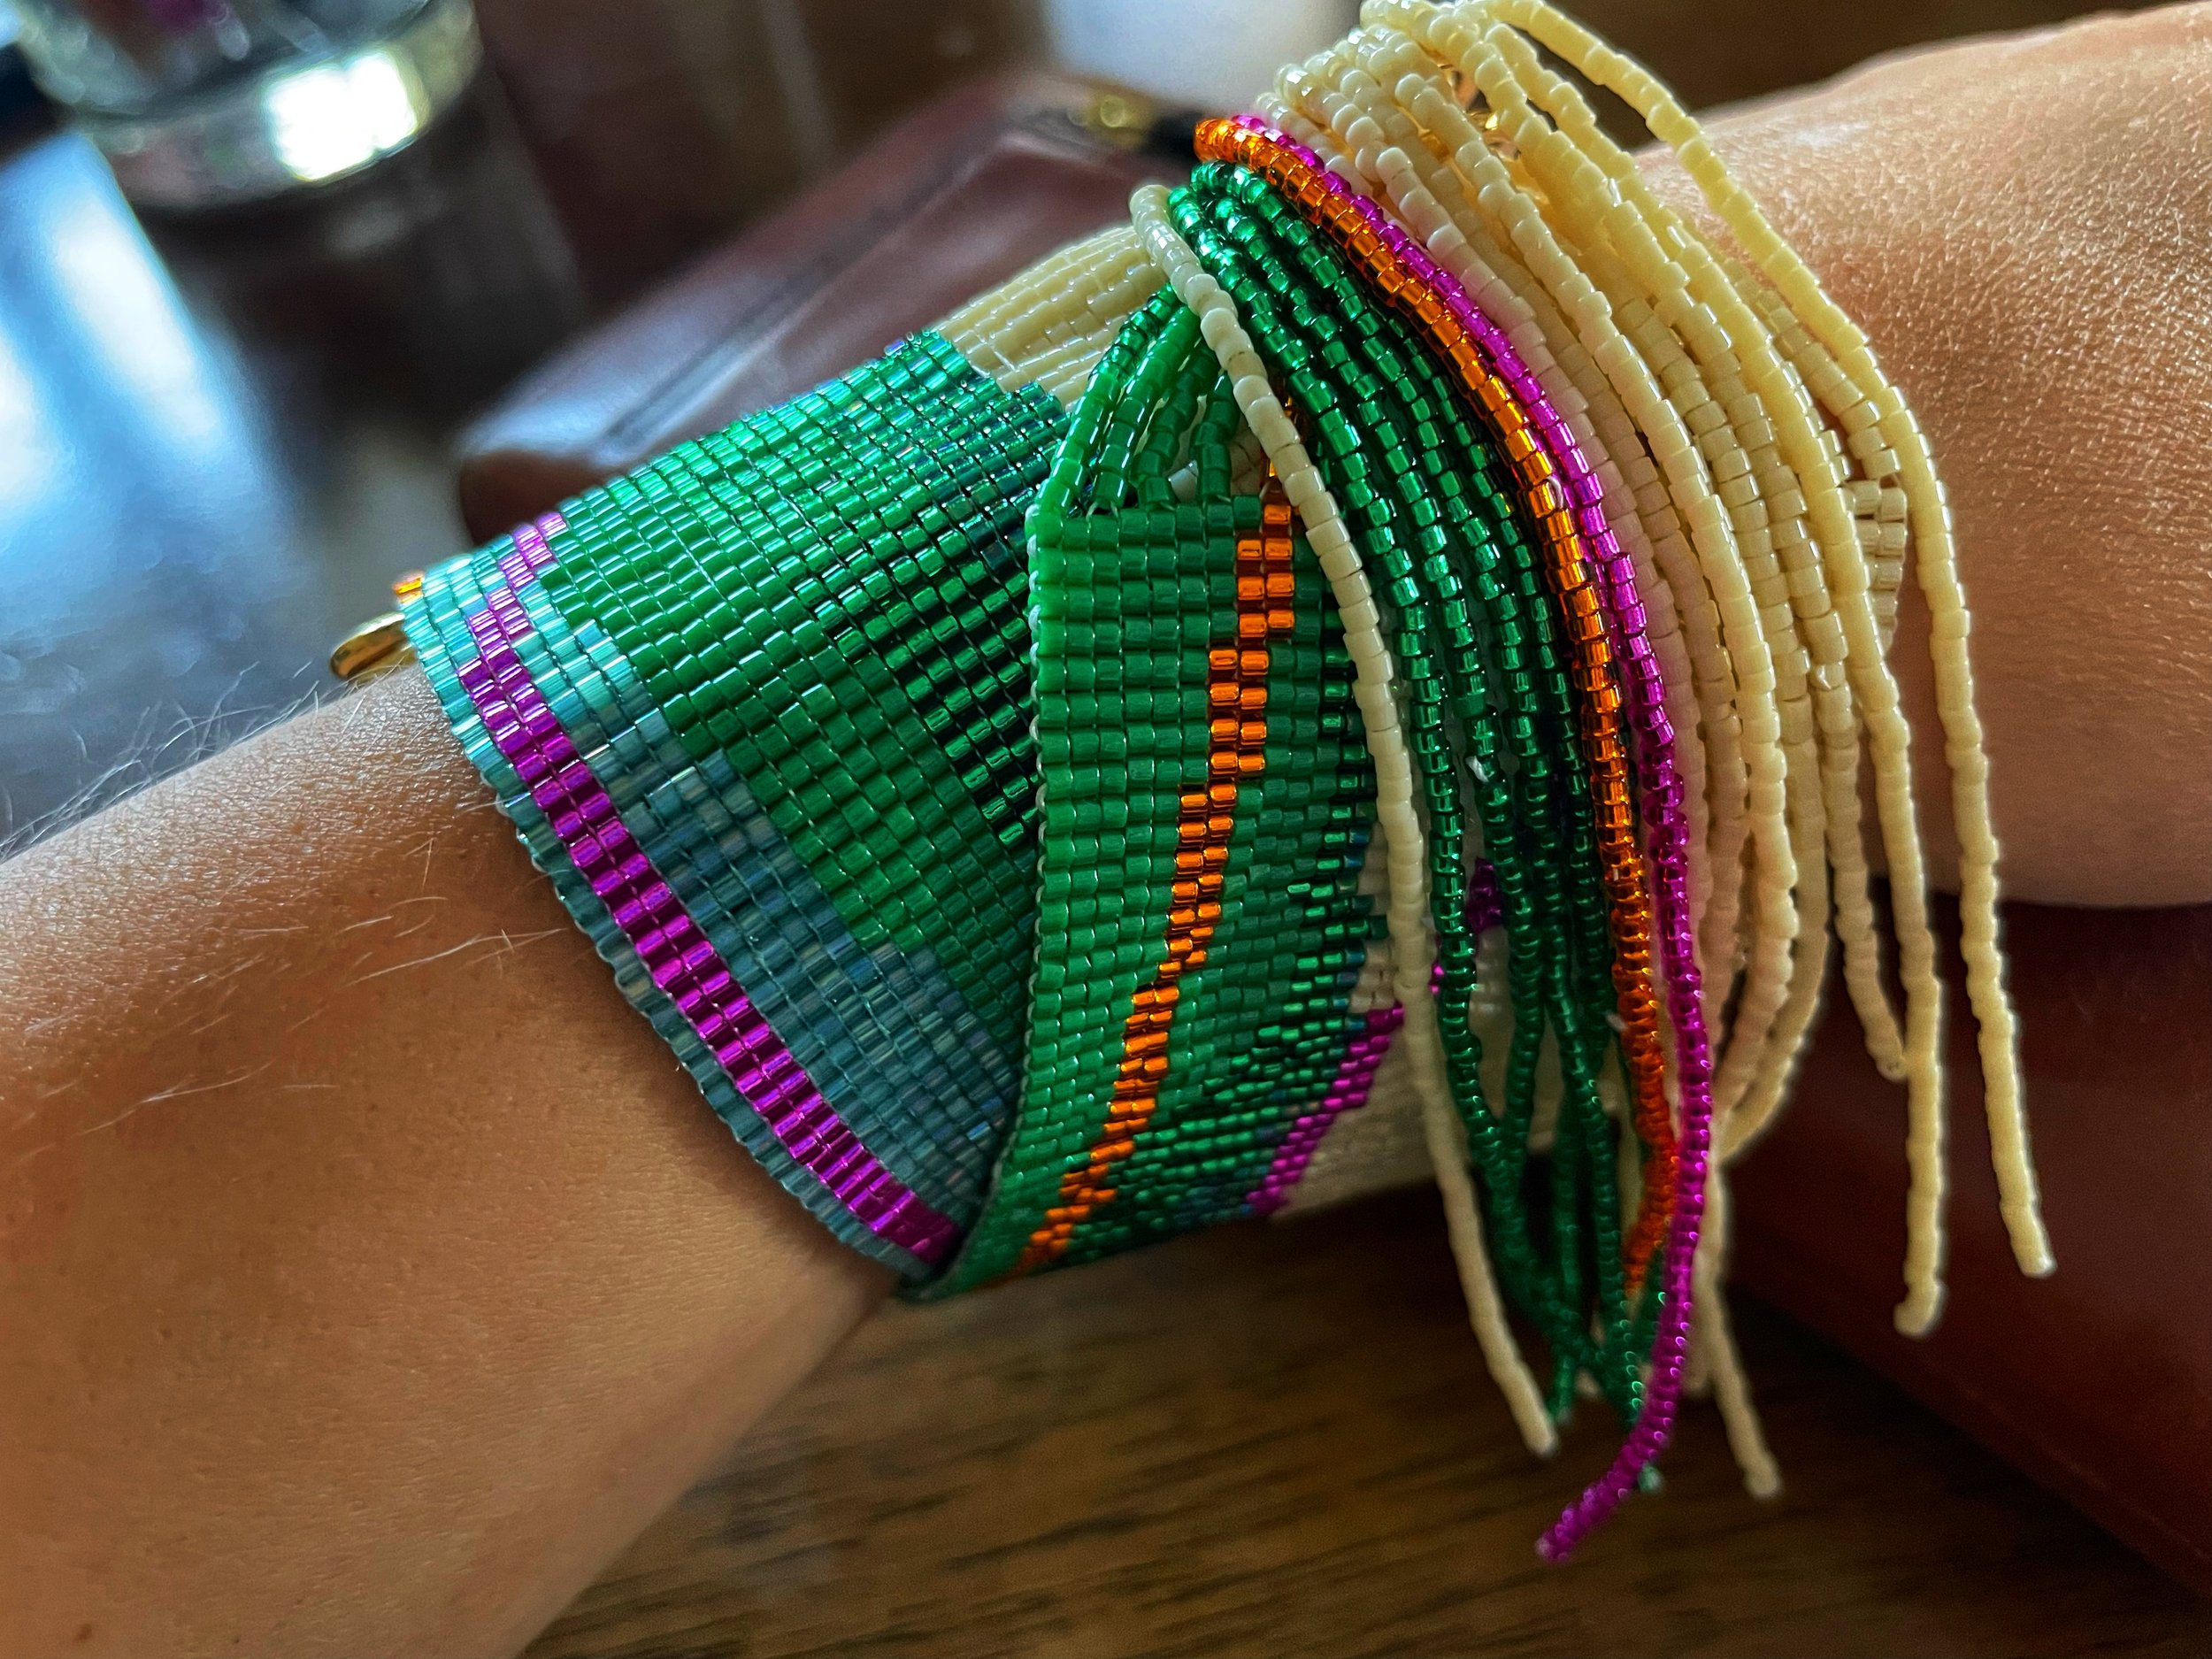
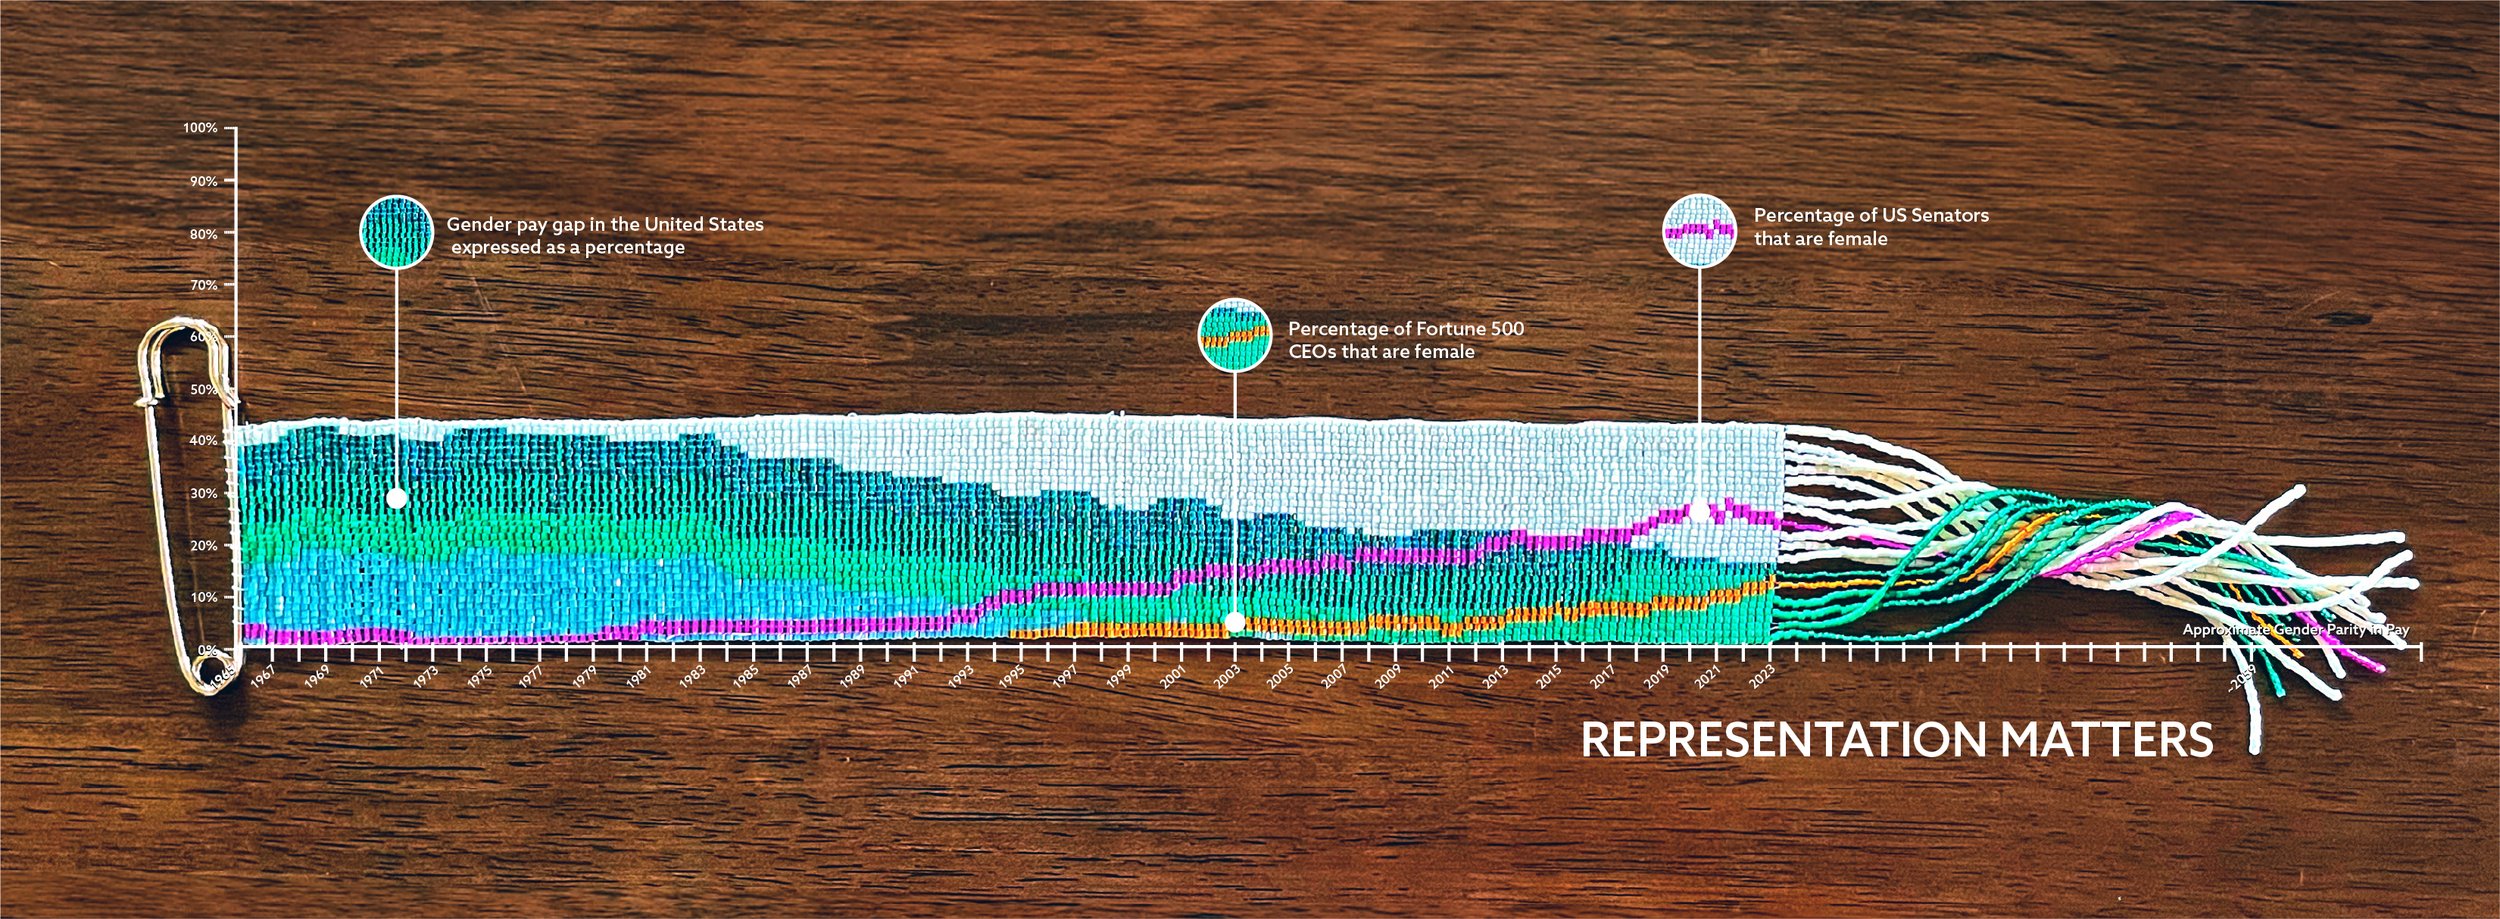
Beads have been used as a form of currency throughout history, and women often use jewelry as powerful symbols of their authority in male-dominated spaces (think power pearls, RBG). For these reasons, I used beaded jewelry to tell a story of representation. The gender wage gap is represented in green from 1965 onwards, and you can see that as more women are present in the senate and as CEOs of Fortune 500 companies, the gap shrinks. Tasseled ends represent the predicted point of parity in pay.

The Process
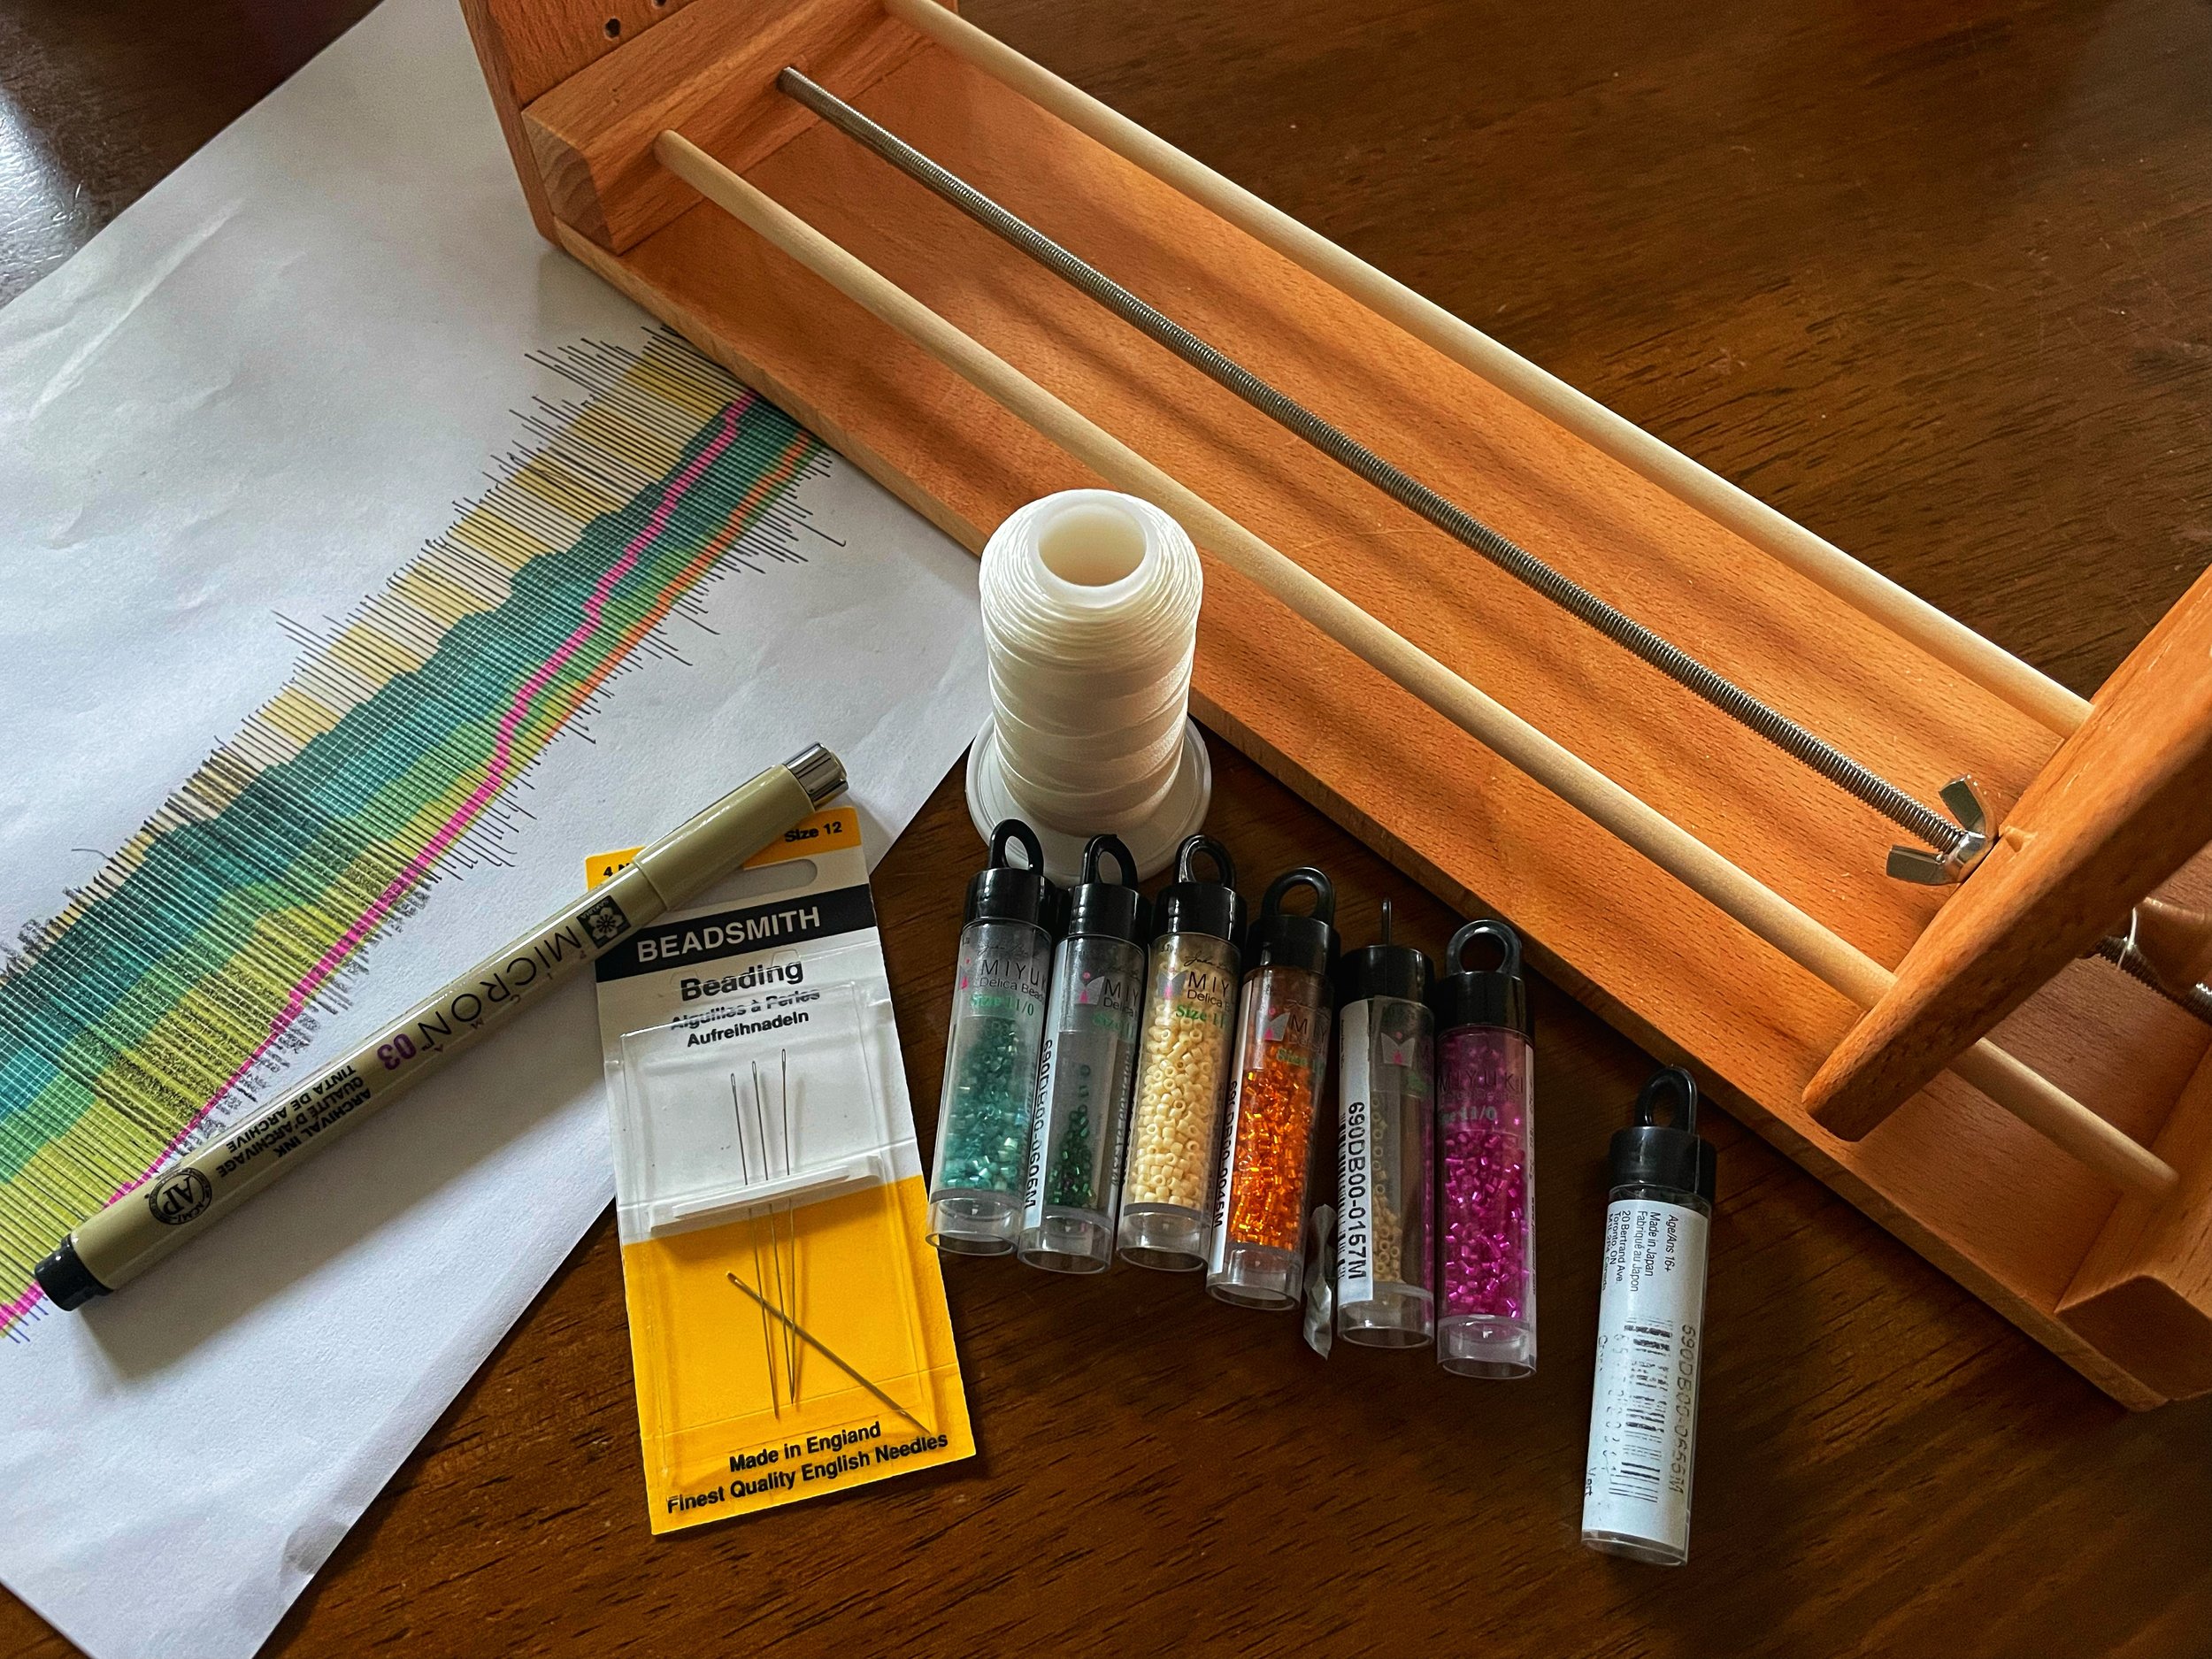
I used D3.js to create the initial graph, and then took the graph into Illustrator to map it onto a gridded pattern for beading. A two-warp loom and delica beads were used to create the final piece.
The data I used comes from the following sources:
The Data on Women Leaders:
https://www.pewresearch.org/social-trends/fact-sheet/the-data-on-women-leaders/
A Timeline of the Gender Pay Gap in the United States: https://www.qualtrics.com/blog/timeline-gender-pay-gap/